Quickstart
The JWST telescope carries four different instruments: NIRCam, NIRSpec, MIRI and FGS/NIRISS — the latter containing the Fine Guidance Sensor (FGS). FGS Spelunker is a package designed to conveniently analyze guidestar data from.
Installation
To install spelunker, use pip install.
pip install spelunker
For in-depth installation steps, visit the installation documentation.
Using the library
Get started with spelunker with only two lines of code.
import spelunker

spk = spelunker.load(pid=1534, token='ENTER_MAST_API_TOKEN')
This will download guidestar data for Program ID 1534; the spk
object itself can then be used to explore this guidestar data! Futhermore, you can specify
your MAST API token with the parameter token to gain access to programs with exclusive rights.
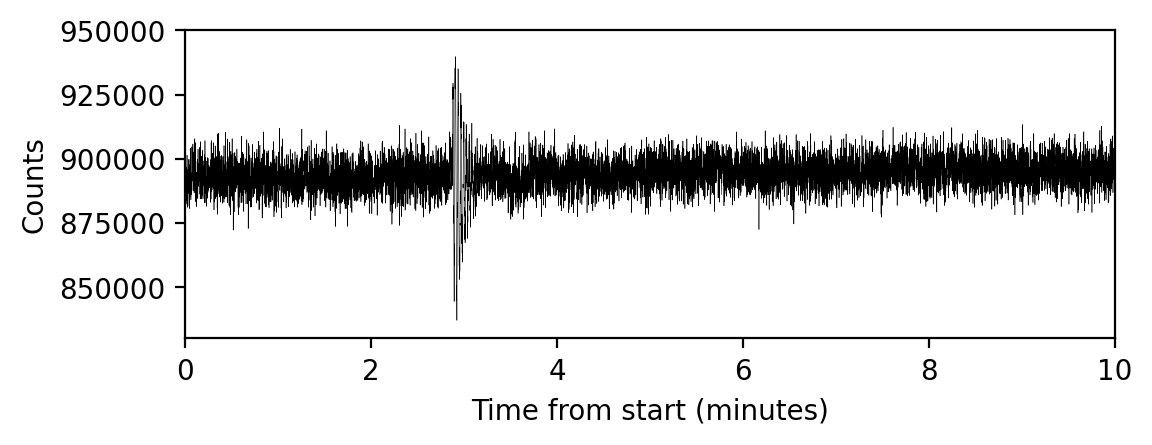
Let us make a plot of the guidestar time-series for the first
minutes of this PID:
import matplotlib.pyplot as plt

# Convert times from MJD to minutes:
fig, ax = plt.subplots(figsize=(6,2), dpi=200)

plt.plot( ( spk.fg_time - spk.fg_time[0] ) * 24 * 60, spk.fg_flux, color='black', linewidth=0.2 )

plt.xlim(0,10)
plt.ylim(830000,950000)
plt.xlabel('Time from start (minutes)')
plt.ylabel('Counts')
(See below on more information that can be extracted, including fitting 2D gaussians to each FGS integration!).
We can even make a plot of the tracked guidestars within this Program ID. Within
a selected Program ID, multiple guidestars could be used for each observation. Each
star or object comes from the Guide Star Catalog (GSC) and is pre-selected depending on
telescope pointing and suitability of the star.
In the generated figure from spk.guidestar_plot, the guidestar positions (marked with an X)
in the given Program ID are plotted from the START to the end of the program. A
line (gs track) is traced between each guidestar to order each used target overtime.
spk.guidestar_plot()

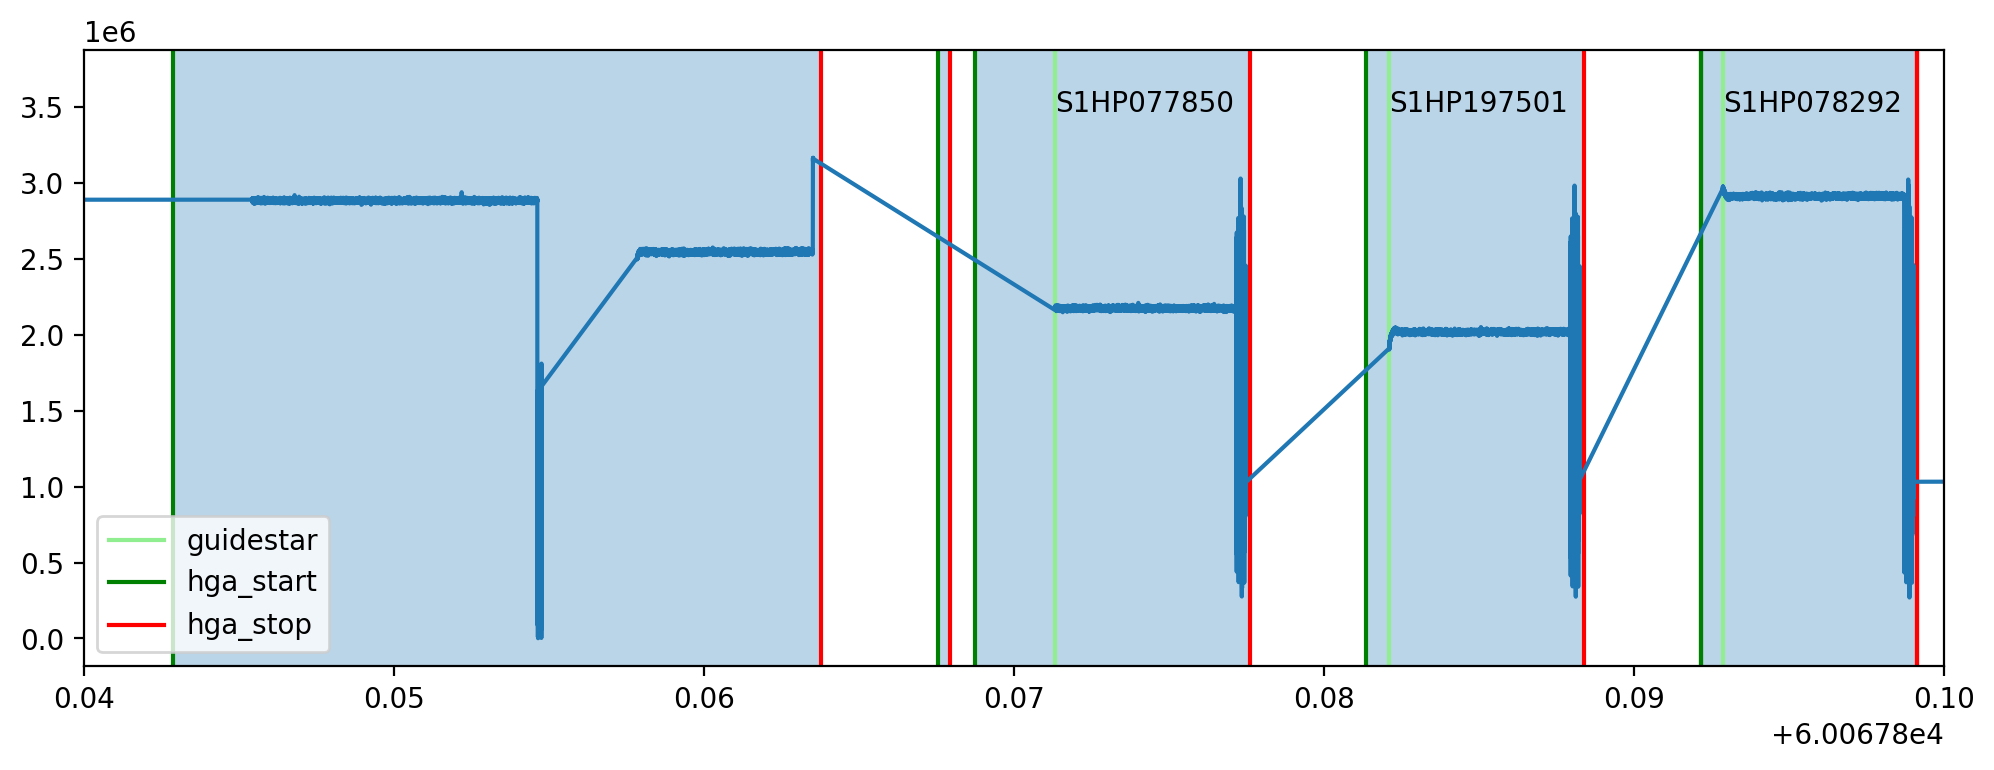
Mnemonics from JWST technical events can be overplotted on any timeseries, such as high-gain antenna (HGA) movement or to identify if the FGS tracks a new guidestar if the jwstuser package is also installed. Here, use spk.mnemonics to access engineering telemetry for SA_ZHAGUPST as a matplotlib axes object:
import matplotlib.pyplot as plt

# for mnemonics to work, you will need to specify a MAST API Token in spk.load
# or you can overwrite the existing token with the attribute spk.mast_api_token.
spk.mast_api_token = 'insert a token from auth.MAST here'

fig, ax = plt.subplots(figsize=(12,4),dpi=200)

ax = spk.mnemonics_local('GUIDESTAR') # plots when the JWST tracks onto a new guidestars as a vertical line
ax = spk.mnemonics('SA_ZHGAUPST', 60067.84, 60067.9) # plots the start and end of high gain antenna movement

ax.plot(spk.fg_time, spk.fg_flux)
plt.legend(loc=3)
plt.xlim(60067.84, 60067.9)
plt.show()